

Amid the swiftly changing landscape of online advertising, where every click and impression carries substantial importance, gaining a competitive edge becomes crucial. In this context, the intricate world of Google Ads takes on a vital role, allowing businesses to engage their target audiences with precision and impact. Embedded within this digital realm is a hidden source of wisdom that can elevate your advertising strategies from ordinary to extraordinary: the Auction Insight Google Ads.
Imagine peering behind the curtains of your online competitors, unraveling their tactics, and strategically positioning your ads for optimal success. This is precisely what Auction Insights brings, offering advertisers an unparalleled glimpse into ad auctions’ dynamics and their rivals’ performance.

In this blog, we embark on a journey to demystify the world of “Auction Insight Google Ads.” We’ll delve into the intricacies of this feature, exploring its definitions, significance, and potential to revolutionize how advertisers approach their campaigns. Join us as we unravel the layers of competitive analysis, dissect the metrics that matter, and unveil the strategies that can elevate your Google Ads game.
So, let’s get started.
Definition Of Auction Insights In Google Ads
Auction Insights is a powerful feature within Google Ads that provides advertisers with valuable data and insights into how their ads perform compared to their competitors. This feature sheds light on various metrics and indicators that help advertisers gauge their competitiveness in the online advertising landscape.
How Do You Access Auction Insight Google Ads Report?
To access Auction Insights reports within Google Ads and unveil the competitive landscape of your campaigns, follow these steps:
- Sign In to Google Ads: Log in to your Google Ads account.
- Navigate to Campaigns: Click on the campaign or ad group you want to analyze.
- Click on “Details”: Within the campaign or ad group view, click on the “Details” drop-down menu.
- Select “Auction Insights.” From the drop-down menu, choose “Auction Insights.”
- View the Report: The Auction Insights report will provide a comprehensive view of how your ads perform compared to your competitors’ ads in critical metrics like Impression Share, Average Position, and more.
After understanding what Google Ads Auction Insights entail and how to access them, let’s now delve into comprehending the pivotal metrics within Auction Insights.
Key Metrics In Auction Insights
- Impression Share (IS)
- Average Position
- Overlap Rate
- Position Above Rate
- Top of Page Rate
- Outranking Share
Explanation Of The Key Metrics Provided In Auction Insights Reports
When understanding your position in the competitive landscape of Google Ads, the Auction Insights report offers a treasure trove of critical metrics to guide your decision-making and optimization strategies. These metrics shed Light on your ad’s visibility, positioning, and performance about your competitors. Let’s dive into the details of each key metric:
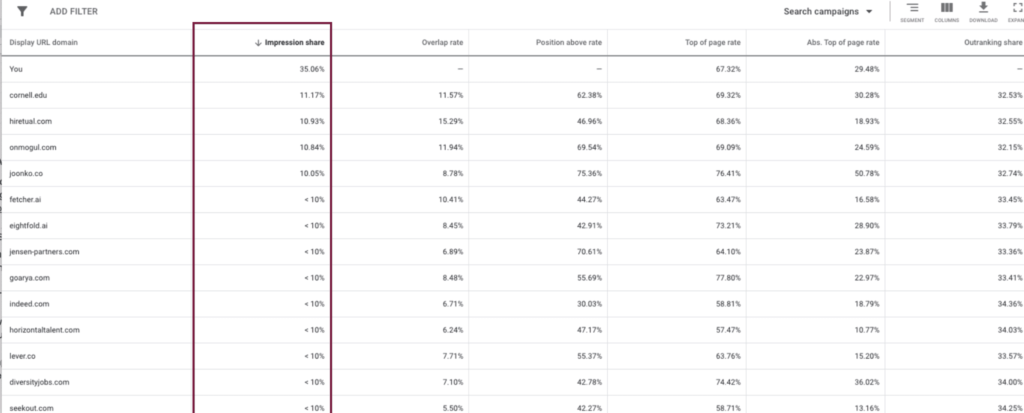
Impression Share (IS)
Impression Share is one of the foundational metrics in Auction Insights reports. It provides insight into the percentage of times your ad was shown out of the total eligible impressions it could have received. In other words, it indicates how successfully your ad was displayed to users searching for the targeted keywords. A high Impression Share suggests that your ads are reaching a significant portion of potential viewers, while a low Impression Share might indicate missed opportunities.
For example, if your Impression Share is 80%, your ads were shown 80% of the time they were eligible to appear. This might indicate that your ads have a good presence, but there’s room to increase your reach. A low Impression Share, say 40%, could signal that your ads miss out on potential views due to budget constraints or ad rank issues.
Average Position
The Average Position metric reveals the average position of your ad on the search engine results page (SERP) about your competitors. A lower number indicates a higher ad position, while a higher number indicates a lower position. While aiming for the top position might seem like the ultimate goal, it’s important to note that position isn’t everything. A lower position might yield better results if it results in higher click-through rates and conversions.
For example, If your Average Position is 1.5, your ad usually appears near the top. This might indicate a strong presence but only sometimes guarantees success. If your competitors’ Average Positions are consistently higher, your ad might require optimization to secure better positions.
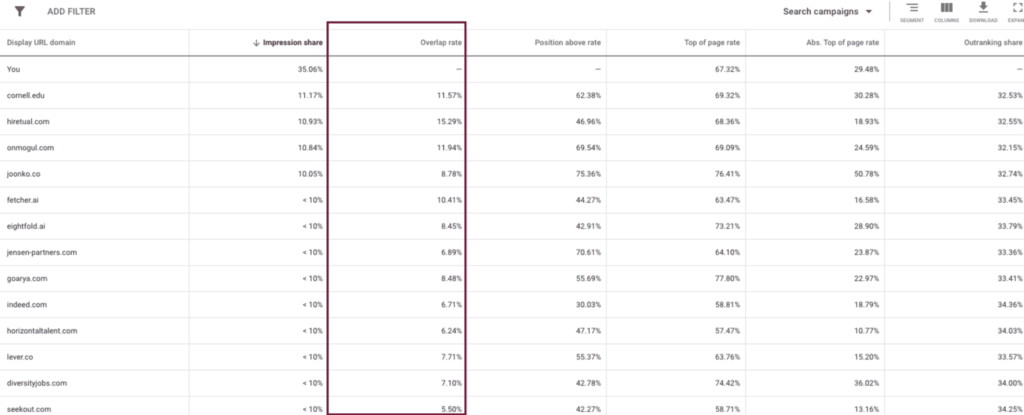
Overlap Rate
The Overlap Rate metric offers insights into how often your ads appear alongside a specific competitor’s ads in auctions. It’s presented as a percentage, reflecting the frequency of simultaneous appearance. A high overlap rate could suggest intense competition for the same target audience. This metric is particularly valuable for identifying which competitors are vying for the same audience segment, allowing you to adjust your strategies accordingly.
For example, If your Overlap Rate with Competitor A is 70%, your ads frequently appear alongside theirs. This might indicate that you’re targeting a similar audience. Adjusting your strategies, such as refining your ad copy to differentiate yourself, can help you stand out in a crowded field.
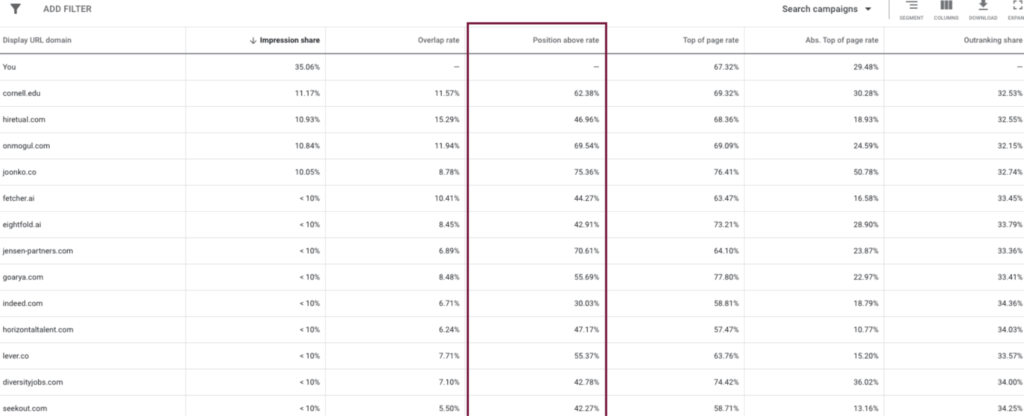
Position Above Rate
Position Above Rate indicates how often your ad appears in a higher position than a competitor’s. This metric provides insights into your competitiveness in terms of ad positioning. If your Position Above Rate is high, your ad often outranks the competitor’s ad, potentially leading to better visibility and clicks.
For example, your ad consistently ranks higher if your Position Above Rate against Competitor B is 60%. This suggests that you’re successfully outranking this competitor, potentially due to better ad quality, relevance, or bid optimization.
Top-Of-The-Page Rate
The Top of Page Rate metric highlights the percentage of times your ad appeared at the top of the search results page (above the organic results). Achieving a top-of-page position can significantly enhance visibility and engagement. Monitoring this metric helps you gauge how effectively your ads secure these prime positions, allowing you to adjust your bidding strategy to increase top-of-page placements.
For example, If your Top of Page Rate is 40%, your ad appeared at the top in 40% of auctions. A high rate indicates that your bidding strategy is effectively securing premium positions. If it’s low, you might need to adjust your bids or keywords to increase top-of-page placements.

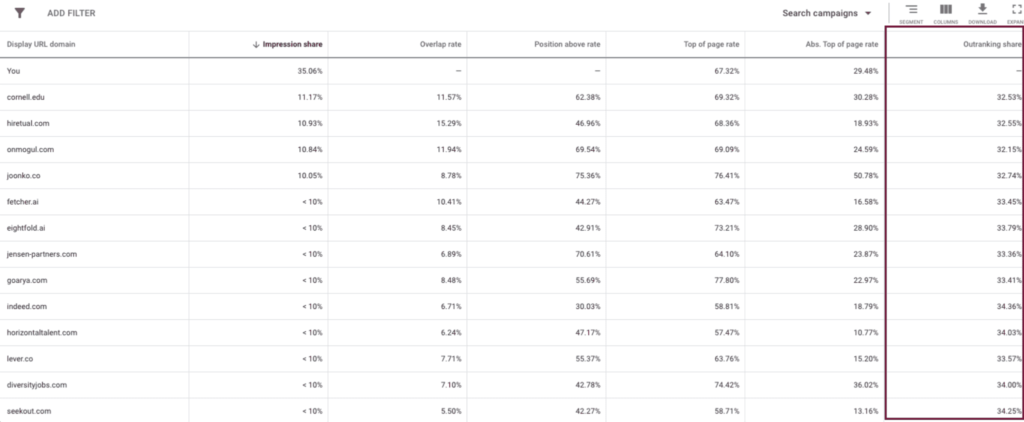
Outranking Share
Outranking Share is a metric that quantifies how often your ad outranks a specific competitor’s ad. It’s presented as a percentage, indicating the share of auctions in which your ad achieved a higher position. A high Outranking Share suggests that your ad consistently prevails over a competitor’s, indicating a solid ad quality and relevance to the target audience.
For example, If your Outranking Share against Competitor C is 75%, it suggests that your ad typically ranks higher. This can indicate that your ad is better optimized or more relevant to users, allowing you to outshine this competitor consistently.
Understanding these key metrics is like having a magnifying glass into the intricacies of your competition and ad performance. By delving into these metrics, you can fine-tune your strategies, optimize your campaigns, and position yourself for success in the highly competitive landscape of Google Ads.
Best Practices For Leveraging Auction Insights
- Regular Monitoring And Analysis Of Auction Insights Data
Keeping a consistent eye on your Auction Insights data is crucial for staying informed about your competitors’ activities. Set up a regular schedule for reviewing these reports, whether weekly, bi-weekly, or monthly. Doing so can identify sudden changes or trends in your competitors’ performance that could impact your bidding strategies.
Action Steps
- Use automated alerts to receive notifications when significant changes in Auction Insights metrics occur.
- Document your observations over time to identify long-term patterns.
- Identifying Trends And Patterns In Competitor Behavior
Don’t just look at the surface-level metrics; dive deeper to uncover trends and patterns in your competitors’ actions. Are there specific times of day or days of the week when they seem more active? Are there keywords they consistently outrank you on? Identifying these trends can help you anticipate their moves and adjust your strategies accordingly.
Action Steps
- Create visual representations (charts or graphs) of Auction Insights data to spot trends quickly.
- Analyze data over different periods to identify recurring behaviors.
- Adapting Strategies Based On Changing Competitive Landscape
The digital advertising landscape is dynamic, with competitors entering and exiting the market. Use Auction Insights data to decide bidding adjustments when new competitors appear or existing ones become more aggressive. Stay flexible and ready to adapt your strategies to maintain your competitive edge.
Action Steps
- Adjust your bidding strategies based on changes in Impression Share, Outranking Share, and other vital metrics.
- Experiment with different bidding approaches to counteract competitor actions.
- Integrating Auction Insights With Broader Marketing Strategies
Auction Insights shouldn’t exist in a vacuum; they should complement your broader marketing efforts. Consider how the insights gained from these reports can influence your ad copy, landing page optimization, and overall campaign messaging. This integration ensures a consistent and well-rounded approach across all marketing channels.
Action Steps
- Share Auction Insights findings with your creative and content teams to align messaging and targeting.
- Use insights to create targeted campaigns that resonate with your audience’s preferences.
- Using Third-Party Tools For Advanced Competitive Analysis
While Google Ads provides valuable Auction Insights data, using third-party tools can enhance your competitive analysis capabilities. These tools might offer additional features, more detailed insights, and even predictive analytics. Incorporating such tools can give you a competitive advantage in understanding your market.
Action Steps
- Research and select third-party tools that align with your needs and budget.
- Combine data from Google Ads and third-party tools for a comprehensive competitive landscape view.
Conclusion
Now that you’re equipped with a deep understanding of Google Ads Auction Insights, it’s time to take action and prevent your competitors from surpassing you. Begin by closely monitoring the crucial metrics discussed earlier, enabling your business to outperform your rivals.
If you still have questions, please leave them in the comments section. We will be happy to answer your questions.
Thanks for reading 🙂


No Comments