A data table display is used to compare report metrics to the website average, allowing you to analyze how specific metrics measure up against the overall average performance of the website.
So the question is, what data table display compares report metrics to the website average? and the options are here:
- Pivot
- Percentage
- Performance
- Comparison
The correct answer is “Comparison.”
What Data Table Display Compares Report Metrics To The Website Average?
In the realm of website analytics, it’s often crucial to gauge how your site measures up against industry benchmarks or your own historical data. To facilitate this, there’s a powerful tool known as the “comparison data table display.” This feature allows you to discern disparities in various metrics by pitting them against the website average.
Comparison Tables in Google Analytics are a valuable feature that allows you to compare two sets of data side by side, providing insights into performance differences, anomalies, or changes over time. These tables are particularly useful for A/B testing analysis, benchmarking, and assessing data variations.
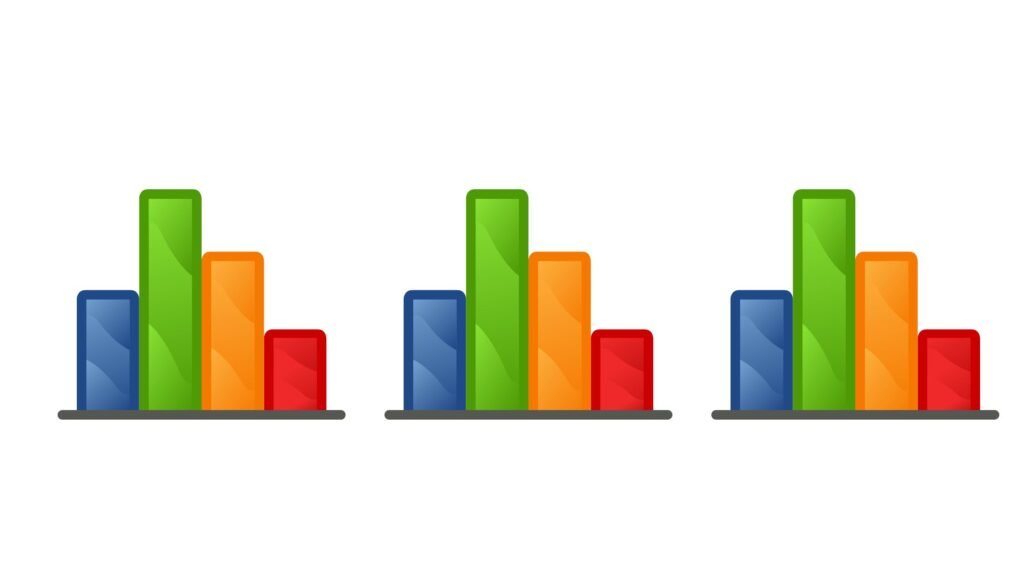
Upon engaging with the comparison data table display, you’ll encounter an illustrative chart that effectively portrays the selected metrics’ performance in relation to the website’s average. The chart adopts a visually intuitive format, featuring both vertical and horizontal bars to highlight the comparative aspects of your data.
Bar Charts In The Comparison View
Bar charts in the comparison view refer to using bar charts as a specific type of visual representation when you want to compare data or values. In this context, you are focusing on the use of bar charts to facilitate comparisons between different categories, groups, or data points.

The primary element within this comparison chart is the bar chart itself. It orchestrates a dynamic representation of your website’s performance metrics against that all-important website average.
Here are some key aspects of using bar charts in a comparison view:
- Data Comparison: Bar charts are ideal for comparing data values among different categories or groups. Each category or group is represented by a separate bar, and the length or height of the bar corresponds to the value it represents. This makes it easy to visually compare values.
- Categorical Data: Bar charts are particularly useful when you have categorical data, such as product sales by month, student scores by subject, or population distribution by region. Each category on the chart can represent a unique category, making it clear which data points you are comparing.
- Axes: In a bar chart, you typically have an x-axis (horizontal) representing the categories or groups and a y-axis (vertical) representing the data values. This axis setup allows for straightforward comparisons.
- Multiple Bars: You can have multiple bars in a bar chart, often grouped or stacked together. This allows you to compare multiple sets of data within the same chart. For example, you might compare the sales of multiple products over time using a grouped bar chart.
- Interactivity: Depending on the software or tool you use to create bar charts, you can often add interactive elements. Users can hover over bars to see specific values, click on bars for more detailed information, or filter data to focus on specific categories of interest.
- Customization: Bar charts can be customized to enhance their visual appeal and effectiveness. You can change the colors of bars, add labels, adjust the scale of the axes, and more to make the chart more informative and engaging.
How To Create A Comparison Data Table In Google Analytics?

Creating a comparison data table in Google Analytics involves using the platform’s reporting features to compare different sets of data. Here’s a step-by-step guide on how to create a basic comparison data table:
- Log in to your Google Analytics account.
- Select the property and view it for your website.
- Navigate to the report you want to analyze.
- Set the date range and apply any segments (if needed).
- Configure the metrics and dimensions for comparison.
- Generate the data table.
- Interpret and analyze the data.
- Export or save the data as necessary.
Benefits Of Creating a Comparison Data Table in Google Analytics
Creating a comparison data table in Google Analytics offers several benefits:
- Data-driven Decision Making: It provides a visual representation of data, making it easier to spot trends, anomalies, and opportunities, which can inform data-driven decisions.
- Performance Assessment: You can compare different time periods, segments, or metrics to assess how your website or marketing efforts are performing.
- Identify Patterns: Helps identify patterns, seasonality, and trends in user behavior and website performance, aiding in strategy refinement.
- Segmentation Insights: Allows you to compare specific user segments, helping you understand differences in user behavior based on demographics, geography, or other criteria.
- Marketing Effectiveness: Evaluate the effectiveness of different marketing channels, campaigns, or content by comparing their impact on website traffic and conversions.
- Optimization Opportunities: Identifies areas that need improvement and optimization, helping you allocate resources more effectively.
Conclusion
A data table display that compares report metrics to the website average is a powerful analytical tool within Google Analytics. It provides website owners and marketers with a clear and structured way to assess the performance of their websites against established benchmarks or historical data.
By leveraging this feature, businesses can make data-driven decisions, identify trends, and pinpoint areas for improvement, ultimately leading to more effective online strategies and enhanced user experiences.
Other Related Questions
1. Are there any third-party tools or integrations that enhance data comparison capabilities in Google Analytics?
A. Yes, there are third-party tools like Google Data Studio, Tableau, Power BI, Supermetrics, and more that can enhance data comparison capabilities with Google Analytics. These tools offer advanced visualization, reporting, and analysis features to help you make the most of your website data.
2. Why is it important to compare report metrics to the website average?
A. Comparing metrics to the website average is important to benchmark performance, detect trends, track goals, identify optimization opportunities, and make data-driven decisions.
3. What is a data table display in Google Analytics, and how does it work?
A. A data table display in Google Analytics is a visual representation of data that allows users to view and compare metrics and dimensions. It works by presenting data in a structured table format, making it easier to analyze, compare, and draw insights from website metrics and user behavior.
4. What report provides data on how specific sections of a website performed?
A. The “Site Content” report in Google Analytics provides data on how specific sections or pages of a website perform.


No Comments