
In today’s data-driven world, businesses thrive on information. The more data a company can gather and analyse, the better equipped it is to make informed decisions. One of the most powerful tools available for managing and interpreting data is a Business Intelligence (BI) dashboard. This blog, “How can a business intelligence dashboard help a business with data collection?” will explore how a BI dashboard can revolutionise business data collection, providing clear and practical benefits.
What is a Business Intelligence Dashboard?
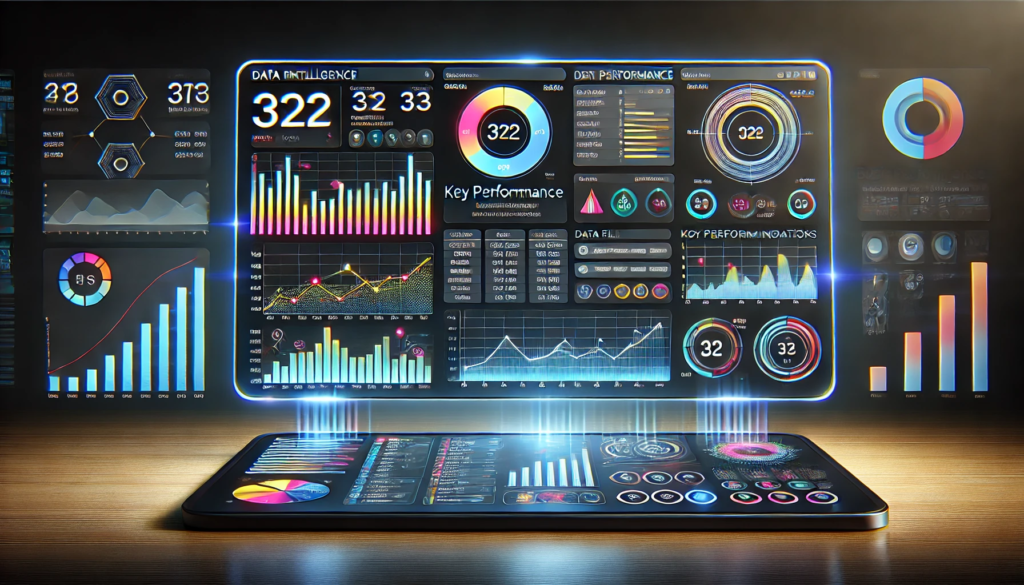
A Business Intelligence dashboard is a data visualisation tool that displays the current status of metrics and key performance indicators (KPIs) for an enterprise. These dashboards consolidate and arrange numbers, metrics, and performance scorecards on a single screen. The goal is to give users a quick, easy-to-read overview of the business’s performance.
Key Features of a Business Intelligence Dashboard
- Data Integration: BI dashboards integrate data from various sources, providing a unified view of business metrics.
- Real-Time Data: Many BI dashboards update in real-time or near real-time, ensuring users can access the most current data.
- Customisable Views: Users can often customise the dashboard to display the most relevant data and metrics for their needs.
- Interactive Elements: BI dashboards may include interactive features like drill-downs, filters, and dynamic data exploration tools.
- Visualisation Tools: These dashboards use charts, graphs, maps, and other visual tools to represent data clearly and effectively.
- Accessibility: BI dashboards are often accessible via web browsers, mobile devices, and desktop applications, providing flexibility in how data is accessed and used.
Benefits of a Business Intelligence Dashboard
- Improved Decision-Making: By providing a comprehensive data view, business intelligence dashboards help businesses make informed decisions quickly.
- Increased Efficiency: Users can quickly identify trends, outliers, and patterns, reducing the time spent on data analysis.
- Enhanced Collaboration: Dashboards can be shared across teams and departments, promoting data-driven collaboration.
- Performance Monitoring: Businesses can continuously monitor KPIs and metrics, allowing for proactive management and quick response to issues.
Why is Data Collection Important in Business?

Data collection is crucial because it helps businesses understand their operations, customers, and market trends. It allows companies to:
- Informed Decision-Making: Data provides insights into business operations, helping leaders make intelligent choices.
- Performance Tracking: By collecting data, companies can track performance metrics and identify areas for improvement.
- Customer Insights: Data helps understand customer behaviours and preferences, leading to better customer service and targeted marketing.
- Competitive Advantage: Analyzing data can reveal trends and opportunities, giving businesses a competitive edge.
- Operational Efficiency: Data collection helps streamline operations, reduce costs, and increase efficiency.
- Risk Management: Identifying potential risks through data analysis allows businesses to mitigate issues before they escalate.
- Strategic Planning: Data supports long-term strategic planning by clearly showing the market and business environment.
- Market Understanding: Gathering data about market trends helps businesses stay relevant and adapt to changes.
How Can a Business Intelligence Dashboard Help a Business With Data Collection?

A business intelligence dashboard is a powerful tool that can significantly enhance a business’s data collection and utilisation processes. Here’s how it helps:
Centralised Data Access
One of the most significant advantages of a BI dashboard is that it centralises data from various sources. Whether the data comes from sales, marketing, finance, or customer service, it can all be integrated into a single dashboard. This centralisation makes it easier for businesses to access and analyse data without switching between different systems or databases.
Real-Time Data Monitoring
BI dashboards provide real-time data monitoring. This means businesses can see the most up-to-date information at any time. Real-time data is crucial for timely decisions, especially in fast-paced industries where conditions change rapidly.
Enhanced Data Visualisation
Raw data can be overwhelming and challenging to interpret. BI dashboards solve this problem by turning complex data sets into easy-to-understand visualisations such as charts, graphs, and tables. These visualisations help stakeholders quickly grasp the significance of the data and identify trends and patterns.
Improved Decision Making
With a BI dashboard, businesses can make more informed decisions. The dashboard provides a comprehensive data view, allowing decision-makers to see the big picture and make choices based on accurate, real-time information. This leads to better strategies and more effective operations.
Customisable Dashboards
BI dashboards are highly customisable. Businesses can tailor their dashboards to display the data and metrics most relevant to their goals and operations. This customisation ensures stakeholders have the necessary information, making data collection more focused and efficient.
Data Integration
A BI dashboard can integrate data from multiple sources, including databases, spreadsheets, and cloud-based applications. This integration provides a holistic business view, combining different data sets to offer deeper insights. For example, sales data can be combined with marketing data to understand the effectiveness of various campaigns.
Increased Efficiency
By automating data collection and analysis, BI dashboards save time and reduce the risk of human error. This increased efficiency allows employees to focus on more strategic tasks rather than spending time manually collecting and analysing data.
Better Collaboration
BI dashboards improve collaboration within an organisation. Since the dashboard provides a single source of truth, different departments can work together more effectively. Teams can share insights and work towards common goals based on the same data, enhancing overall productivity.
Performance Tracking
Tracking performance is essential for any business. BI dashboards allow companies to set KPIs and track them in real time. This ongoing monitoring helps businesses stay on track to meet their goals and quickly identify any areas that need attention.
How to Implement a Business Intelligence Dashboard?
Implementing a BI dashboard involves several steps:
- Define Objectives
Before creating a dashboard, defining what you want to achieve is essential. Identify the key metrics and KPIs that are most important for your business. This will guide the design and functionality of your dashboard.
- Choose the Right Tool
Many BI tools are available, each with its strengths and weaknesses. Choose a tool that fits your business needs, budget, and technical capabilities. Some popular options include Tableau, Power BI, and Looker.
- Integrate Data Sources
Connect your data sources to the BI tool. This might include databases, CRM systems, marketing platforms, and financial software. Ensure that the data is clean and consistent to get accurate results.
- Design the Dashboard
Design your dashboard to be user-friendly and visually appealing. Present the data clearly using charts, graphs, and tables. Keep the design simple and focused on the key metrics.
- Train Your Team
Ensure that your team knows how to use the dashboard effectively. Provide training and support to help them understand how to access and interpret the data.
- Monitor and Adjust
Once the dashboard is up and running, monitor its performance and adjust as needed. Continually refine the dashboard to ensure it meets your business needs and provides valuable insights.
What Are the Challenges and Solutions?
While BI dashboards offer many benefits, there can be challenges in their implementation and use. Here are some common challenges and their solutions:
- Data Quality
Challenge: Poor data quality can lead to inaccurate insights.
Solution: Implement data cleaning and validation processes to ensure the data is accurate and reliable.
- User Adoption
Challenge: Employees may be resistant to using a new tool.
Solution: Provide training and support to help users understand the benefits of the dashboard and how to use it effectively.
- Integration Issues
Challenge: Integrating data from multiple sources can be complex.
Solution: Use a BI tool that supports a wide range of data integrations and work with IT professionals to ensure seamless integration.
- Keeping Data Secure
Challenge: Data security is a significant concern, especially with sensitive information.
Solution: To protect your data, implement robust security measures, such as encryption and access controls.
- Performance and Scalability
Challenge: As data volumes grow, performance may degrade, impacting the user experience.
Solution: Choose a BI tool that can scale with your needs and optimise data storage and processing to maintain performance.
- Customization and Flexibility
Challenge: Out-of-the-box dashboards may not meet all business needs.
Solution: Select a BI tool that allows extensive customisation and flexible reporting options to tailor the dashboard to specific business requirements.
- Cost Management
Challenge: Implementing and maintaining a BI dashboard can be costly.
Solution: Conduct a cost-benefit analysis to justify the investment and explore cloud-based BI solutions to reduce infrastructure costs.
- User-Friendly Interface
Challenge: Complex dashboards can be complicated for non-technical users to navigate.
Solution: Design intuitive and user-friendly interfaces and use data visualisation best practices to make insights easily accessible.
- Monitoring and Maintenance
Challenge: Ongoing maintenance is necessary to keep the dashboard relevant and functional.
Solution: Set up regular monitoring and maintenance schedules to update data sources, refresh reports, and incorporate user feedback.
- Collaboration and Sharing
Challenge: Sharing insights and collaborating on data can be cumbersome.
Solution: To facilitate teamwork, use a BI tool with collaboration features, such as sharing dashboards, annotations, and real-time updates.
What Are the Future Trends in BI Dashboards?
The field of business intelligence is constantly evolving. Here are some future trends to watch:
- AI and Machine Learning Integration
Advanced AI algorithms will automate data analysis, providing deeper insights and predictive analytics, helping businesses make more informed decisions.
- Natural Language Processing (NLP)
NLP will enable users to interact with dashboards using conversational language, making data insights accessible to non-technical users.
- Augmented Analytics
This will enhance data exploration by automatically identifying patterns, correlations, and anomalies, thus speeding up the decision-making process.
- Real-time Data Visualization
Dashboards will increasingly support real-time data updates, allowing businesses to react quickly to changing conditions.
- Personalization and Customization
User-specific dashboards will become more common, providing tailored insights and metrics that cater to individual roles and preferences.
- Mobile Optimization
As the workforce becomes more mobile, dashboards will be designed for optimal viewing and interaction on smartphones and tablets.
- Embedded Analytics
Integration of dashboards into everyday business applications will streamline workflows and provide contextually relevant insights.
- Enhanced Security
With the increasing importance of data privacy, dashboards will incorporate advanced security features to protect sensitive information.
- Collaboration Features
Dashboards will offer more collaborative tools, enabling teams to seamlessly share insights, comment on data, and make collective decisions.
Conclusion
A Business Intelligence dashboard is a powerful tool that can transform how businesses collect, analyse, and use data. By centralising data access, providing real-time insights, and enhancing data visualisation, BI dashboards enable enterprises to make informed decisions, improve efficiency, and stay competitive in a data-driven world.
Implementing a BI dashboard requires careful planning and execution, but the benefits outweigh the challenges. As technology continues to evolve, BI dashboards will become even more integral to business operations, helping companies harness the full potential of their data.
Incorporating a BI dashboard into your business strategy is not just a smart move; it’s essential for staying ahead in today’s competitive market. Embrace the power of data and let a BI dashboard guide your business to success.


No Comments